Technical Analysis
Looking at a stock’s chart can quickly tell you how millions of people feel about that stock. The price has been going up over the last month? Maybe there is some good news out about their revenues, an acquisition or a new product launch. Maybe the stock was so beaten up from some bad news earlier, the majority of people think it’s at a cheap price and want to buy it again.
Technical analysis is a method to evaluate price trends and chart patterns and since it is widely used by traders, some of these trends and patterns become self-fulfilling prophecies.
Moving averages
Moving averages are very popular indicators on most charts. The indicator plots the average price of a stock over a specified amount of time to help easily identify trends.
A lot of traders use moving averages as support or resistance to help identify trading opportunities. Another popular indicator for a possible change in trend is when two moving average lines with different time frames, cross over each other.

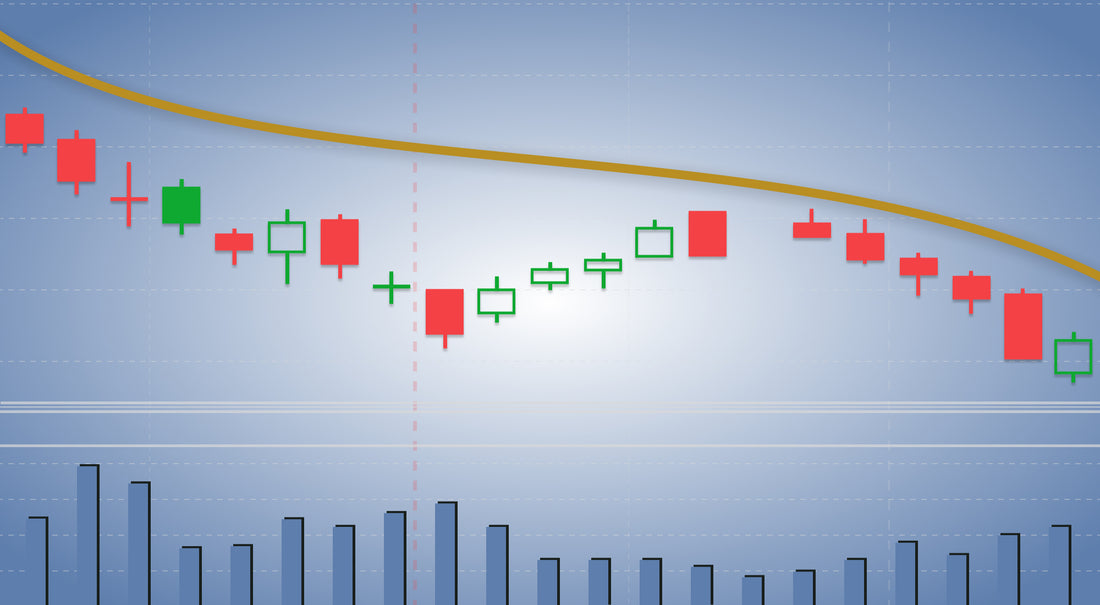
This daily chart of LULU shows how the moving average (shown in yellow) can act as resistance
VWAP
VWAP, or volume-weighted average price, is another indicator that calculates the average price of a stock throughout the day. It is different from a moving average because it incorporates the amount of volume traded during each transaction which better illustrates the average price traders pay for the given stock during the day.
VWAP is best used as an indicator for intraday trends and can help identify entry and exit points for a trade. On days where a stock is in a strong trend it will stay above (uptrend) or below (downtrend) VWAP most of the day. Daytraders will buy (uptrend) or sell short (downtrend) when the stock price gets close to VWAP further solidifying the trend.

Here is an intraday chart of AAPL showing how VWAP can act as resistance.
Support
Support is a price point where people tend to buy the stock and keep the price above that support level. The crowd thinks this is a cheap price for the stock and everyone is eager to buy it there.
It takes extra selling pressure to break through support. Either a large shareholder decides to exit their position or a bunch of smaller shareholders all want out.
Once support is broken and the stock price falls below the support level, it can later act as resistance in some cases.

Here is a chart of BIDU for the past few months with a support level drawn in around $135. Notice how quickly the stock price drops after the support level is broken on the right side of the chart.
Resistance
Resistance is a price point where people think the stock is too expensive. It could be a bunch of people’s profit target so whenever the price gets to that level, it is met with a large influx of selling which causes the price to fall again and reinforces the idea that that price point is resistance.
Like support, it takes extra effort to break through resistance but once the price successfully does, the old resistance level can become support for future price action.

Here is a 5 minute chart for AMD with an intraday resistance level at $115.
Volume
Volume is simply the amount of shares traded for a specific time period. This indicator is located at the bottom of a stock chart as a bar graph. Volume doesn’t indicate much by itself but can often times help add context to a stock’s price action.
For example, if a stock price breaks through support or resistance and is accompanied by a larger than normal amount of volume that is often an indicator that the stock’s trend is very strong and will likely continue in the direction it is headed in the short-term.