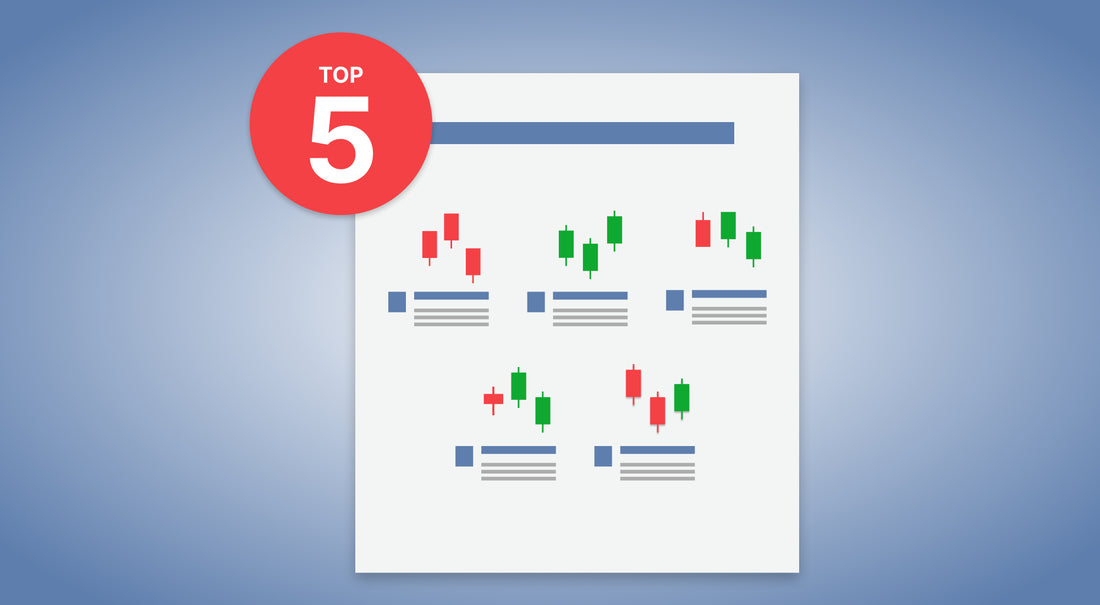
Anatomy of a Candlestick

In the spirit of anatomy, I would lift their tails to show you the difference between girl and boy candlesticks, but they’re Japanese so it’ll just be pixelated.
As with most things on the chart, the candle’s overall significance depends largely on the time frame it represents and the overall context of the chart. A candlestick pattern when looking at a 2 minute chart will indicate intraday moves while a candlestick pattern on a daily or weekly chart could indicate a move with a longer duration.
1. Doji

A Doji candlestick occurs when the opening and closing price are pretty much the same creating a thin line for the actual body of the candle. In the context of recent price action, it can be a strong indicator of a reversal.
This represents an equilibrium between buyers and sellers. So if this occurs after a big move up, that could be a sign that the buyers are exhausted and the sellers might be taking control soon.
2. Three black crows

This must have been named before color was invented because now this would be three red crows…and that doesn’t really make sense. Maybe they violently murdered someone’s portfolio and are covered in blood? Anyway, it’s a bearish pattern of three big down days in a row. It’s characterized by long bodied candles and each one makes a new low from the previous one.
This could be a bad omen for the stock longer term or it could just be a small pullback in a strong uptrend before the stock price continues higher. It’s not that the crows caw, but how they cawed.
3. Hammer

The hammer candlestick looks like…a hammer. It has a smaller body with a long tail that shows the price declined during the day quite a bit but buyers were able to step in and bring the price back closer to where it opened. This shows a lot of strength from the buyers and could indicate a trend reversal. As with most things on charts, use other factors as well to help you determine if your hammer in question is a legit reversal. Wear parachute pants while you do it to increase your odds of success.
4. Shooting Star

A shooting star candlestick pattern has a similar look to a hammer but it occurs after an uptrend. It can also signal a reversal but confirmation is needed since one candle alone doesn’t really tell the whole story. Unless it’s unattended and a house burns down. Then usually that’s the whole story.
The shooting star has a small body and a long upper wick showing that buyers were trying to push the price higher but lost momentum and sellers were able to beat the price back down to almost where it opened for the day.
5. Engulfing

This is my favorite pattern. It’s like the candlesticks are spooning. You see this and walk away from your charts for 5 or 10 minutes and you’ll come back to Marvin Gaye playing on your Spotify and more candles appearing before your very eyes. The magic of love.
As I hinted at, this is a two candle pattern where the second candle’s body fully engulfs the first candle’s highs and lows. This can be either bullish or bearish. In a bullish engulfing pattern, the second day’s price opens below yesterday’s lows and rises during the trading session enough to exceed yesterday’s high of day. The second candle will usually close near its high of day indicating more strength and possible continuation of the rising prices for the next day. Same same but opposite for bearish engulfing candles.
In Summation
All of these candlestick patterns can be found throughout many charts and offer insight to what might be going on in the market’s psychology regarding a certain stock. Unfortunately, there is never a sure thing in trading and candlestick patterns are no different. Being aware of candlestick patterns like these can help you make a more informed trading decisions within the context of the chart and other indicators. Remember, a candle can light the way but if you trust it too much it could sleep with your wife and burn your house down.